
Alfamart vs Indomart dominance in Jakarta
Alfamart and Indomart are two of the most popular convenience stores in Indonesia.
For thought experiment, lets try to explore the data that we can get from OpenStreetMap about it. Do note though that OSM data is not always complete and up to date, so the results might not be 100% accurate. If you notice specific place are missing, do try to add them on OSM!
Pull list of minimarket
To do this, we are using osmnx library, which simplify the query process to the OpenStreetMap database, and we got a tidy GeoDataFrame ready to process further.
import osmnx as ox

# Define the area - using Jakarta's bounding box
bbox = (106.6894, -6.3697, 106.9755, -6.1297)  # (west, south, east, north)

alfamart_tags = {'brand': 'Alfamart'}
alfamart = ox.features.features_from_bbox(bbox, tags=alfamart_tags)

indomaret_tags = {'brand': 'Indomaret'}
indomaret = ox.features.features_from_bbox(bbox, tags=indomaret_tags)

# Print the number of Alfamart and Indomaret locations
print(f"Number of Alfamart: {len(alfamart)}")
print(f"Number of Indomaret: {len(indomaret)}")
Number of Alfamart: 305
Number of Indomaret: 413
import pandas as pd
from shapely.geometry import Point
import geopandas as gpd

alfamart_points = gpd.GeoDataFrame(
    geometry=[Point(geom.centroid.xy) for geom in alfamart.geometry],
    crs=alfamart.crs
)
alfamart_points['type'] = 'Alfamart'

indomaret_points = gpd.GeoDataFrame(
    geometry=[Point(geom.centroid.xy) for geom in indomaret.geometry],
    crs=indomaret.crs
)
indomaret_points['type'] = 'Indomaret'

# Combine the data
all_points = pd.concat([alfamart_points, indomaret_points])
Plotting the data
Now, we can plot the data on a map. We will use contextily to add the basemap, and matplotlib to plot the data.
Show code (71 lines)
# Create a map using contextily and matplotlib
import contextily as ctx
import matplotlib.pyplot as plt

all_points_gdf = gpd.GeoDataFrame(all_points)
# Create figure and axis
fig, ax = plt.subplots(figsize=(15, 15))

# Ensure data is in Web Mercator projection (EPSG:3857) for contextily
all_points_gdf = all_points_gdf.to_crs(epsg=3857)

# Calculate grid size for zoom level 11 (in meters since we're in Web Mercator)
grid_size = 1_000

# Group points into grid cells
all_points_gdf['grid_x'] = (all_points_gdf.geometry.x // grid_size) * grid_size
all_points_gdf['grid_y'] = (all_points_gdf.geometry.y // grid_size) * grid_size

# Count stores by type in each grid cell
grid_counts = all_points_gdf.groupby(['grid_x', 'grid_y', 'type']).size().unstack(fill_value=0)
grid_counts['dominant'] = grid_counts.idxmax(axis=1)
grid_counts['difference'] = abs(grid_counts['Alfamart'] - grid_counts['Indomaret'])

# Create rectangles for each grid cell
for idx, row in grid_counts.iterrows():
    grid_x, grid_y = idx

    # Color intensity based on dominance
    opacity = min(row['difference'] / 5, 0.8)  # Cap at 0.8 opacity

    # Red for Alfamart dominance, Blue for Indomaret
    color = 'red' if row['dominant'] == 'Alfamart' else 'blue'

    # Create rectangle
    rect = plt.Rectangle(
        (grid_x, grid_y),
        grid_size,
        grid_size,
        facecolor=color,
        alpha=opacity,
        edgecolor='none'
    )
    ax.add_patch(rect)

# Set map bounds to Jakarta area (converted to Web Mercator coordinates)
# Set bounds based on the data points with some padding
x_min = all_points_gdf.geometry.x.min()
x_max = all_points_gdf.geometry.x.max()
y_min = all_points_gdf.geometry.y.min()
y_max = all_points_gdf.geometry.y.max()
x_padding = (x_max - x_min) * 0.1
y_padding = (y_max - y_min) * 0.1

ax.set_xlim([x_min - x_padding, x_max + x_padding])
ax.set_ylim([y_min - y_padding, y_max + y_padding])

ctx.add_basemap(
    ax,
    source=ctx.providers.CartoDB.Positron,
    crs=all_points_gdf.crs
)

legend_elements = [
    plt.Rectangle((0,0), 1, 1, facecolor='red', alpha=0.6, label='Alfamart Dominant'),
    plt.Rectangle((0,0), 1, 1, facecolor='blue', alpha=0.6, label='Indomaret Dominant')
]
ax.legend(handles=legend_elements, loc='upper right')
ax.set_axis_off()

plt.title('Minimarket Chain Dominance in Jakarta\nGrid size: ~1km', pad=20)
plt.show()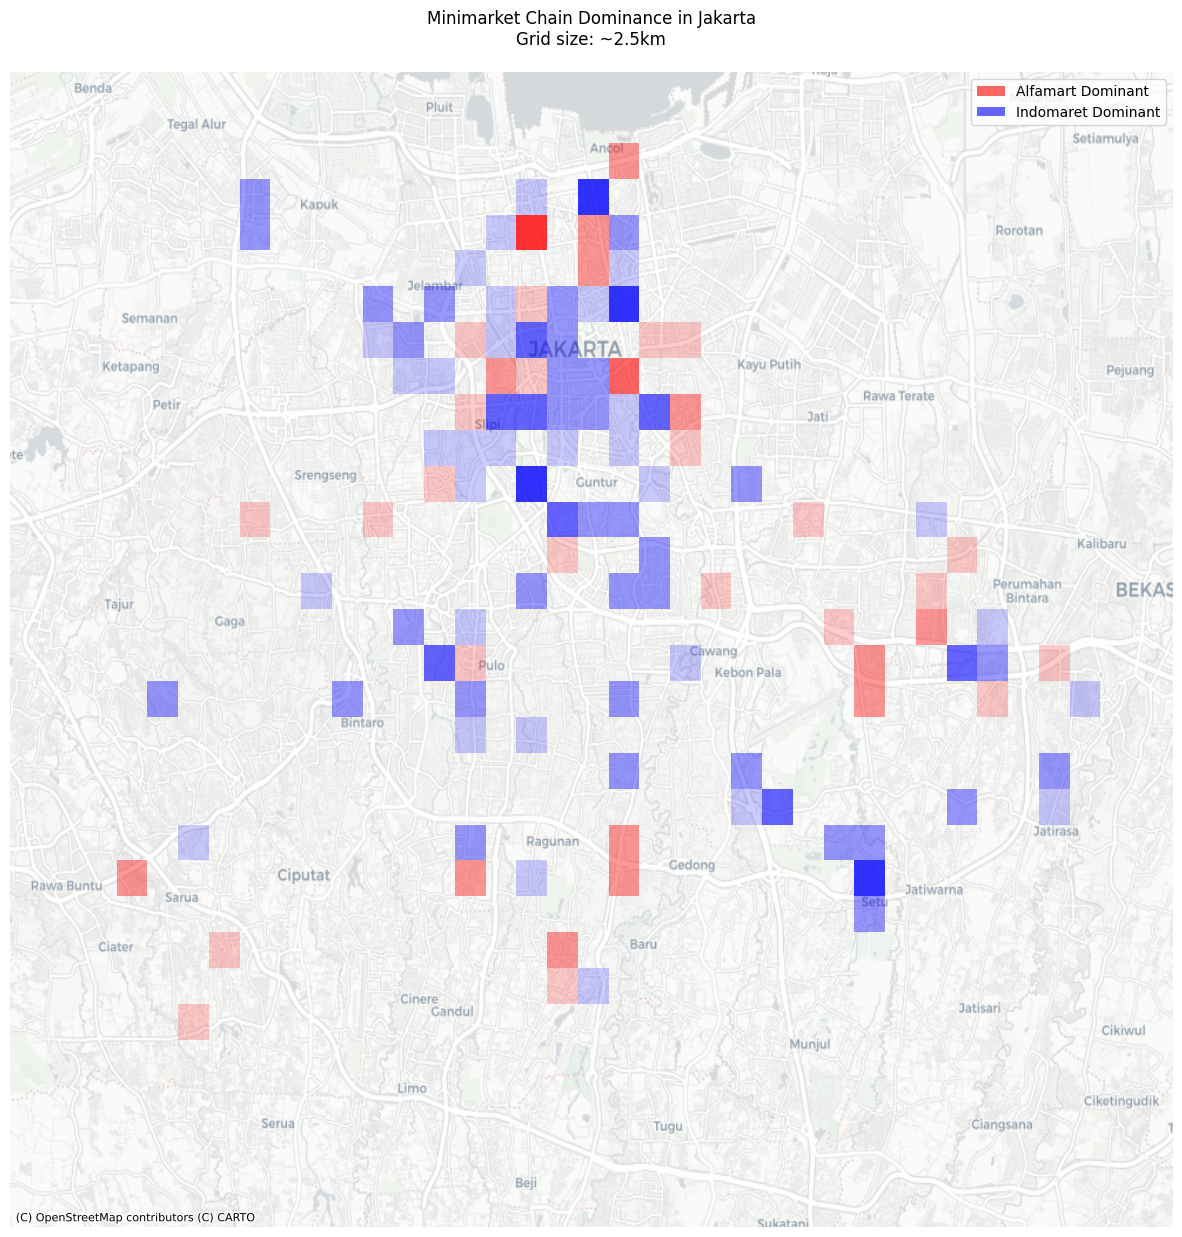
🗒️ Download (alfamart-vs-indomart.ipynb)